I actually searched before asking this, and found this thread about profile. Where the tool “profile” was mentioning. So I tried it!
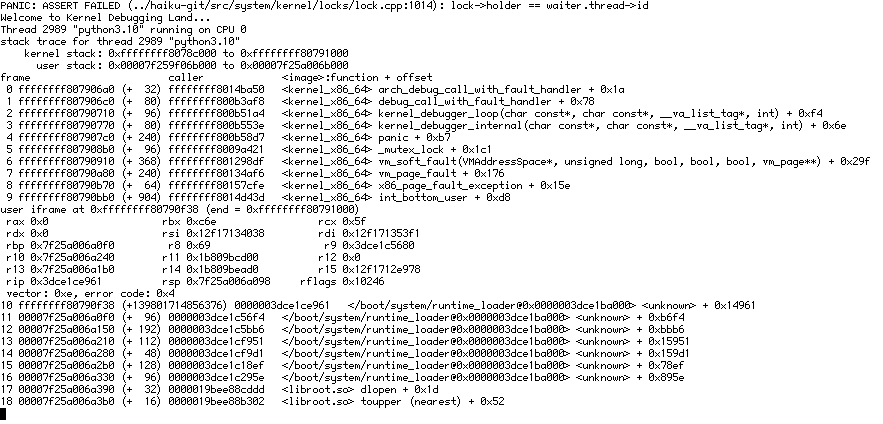
Fun times were had:
Haha… anyone else got a better idea? One of my app’s windows runs super super slow. Everything grinds to a halt for no apparent reason and finding out what code is running would be nice.
1 Like
Have you tried attaching the Debugger application and stepping through or setting breakpoints?
I’m aware I can do that… but it’s a bit hit and miss. I could also litter the code with printfs and see what sticks. But I thought I try the “proper” way first…
Well, you can report the issue on our bugtracker. The assert should normally not be hit anyhow. : )
Well… er… I was fixing other issues. Various crashes and locking problems. And then came back to this, only to find… it’s fine now. Hmmm… haha… such is software development.
Not the kernel panic, but the original slowness in my dialog.
2 Likes
If you can still reproduce the KDL then a ticket would be nice regardless. : D
2 Likes
Yes, I can’t recall having seen a panic with this stack trace before (and I run the profiler not infrequently.) So if it’s reproducible, please do give steps for it.