Optimize applications under Haiku

Summary

This article present how to use tools available under Haiku to analyze performance of Haiku applications in order to Optimize them.

Tools used in this tutorial :

  • profile
  • c++filt
  • QCachegrind

The first two comes with Haiku.
The latest need to be installed using HaikuDepot (GUI) or pkgman (command line).

Overview of the process

This is basically a three steps process :

  • identify a scenario that appears to be slow
  • measure the performance using profile
  • analyze results using QCachegrind

Measure

profile is a sample-based profiler : this tool stop the measured process at regular interval and look at the call stack at this point. The more you stop in a specified function, the more likely this function eat CPU.

All data are consolidated and written in the output directory.

profile -v [output directory] -i [tick interval in ms] [process to start]

The -v option generate data in a format suitable for QCachegrind that we will use later.

Example :

profile -v output_dir -i 300 HaikuDepot

This example generate one file per thread. Depending on what you are looking for, you might prefer to have everything in one file. You can do this using the -S option :

profile -v output_dir -i 300 -S HaikuDepot

Then, you should redo your test case in the launched application. When you close it, measures are written in output directory specified with the -v option.

More options in profile are available. See profile --help

Tips

Haiku is mainly written in C++. Function names in C++ binaries are encoded using a specific scheme. This process is called mangling.
In order to have more readable functions name in the analysis, you can use C++filt to pre-process result’s files.

c++filt < [measureFile] > [resultFile]

example :

c++filt < measure_file > unmangled_measure_file

Analyze

Finally, you should start QCachegrind. From there, open the unmangled_measure_file that you have generated at the previous step.

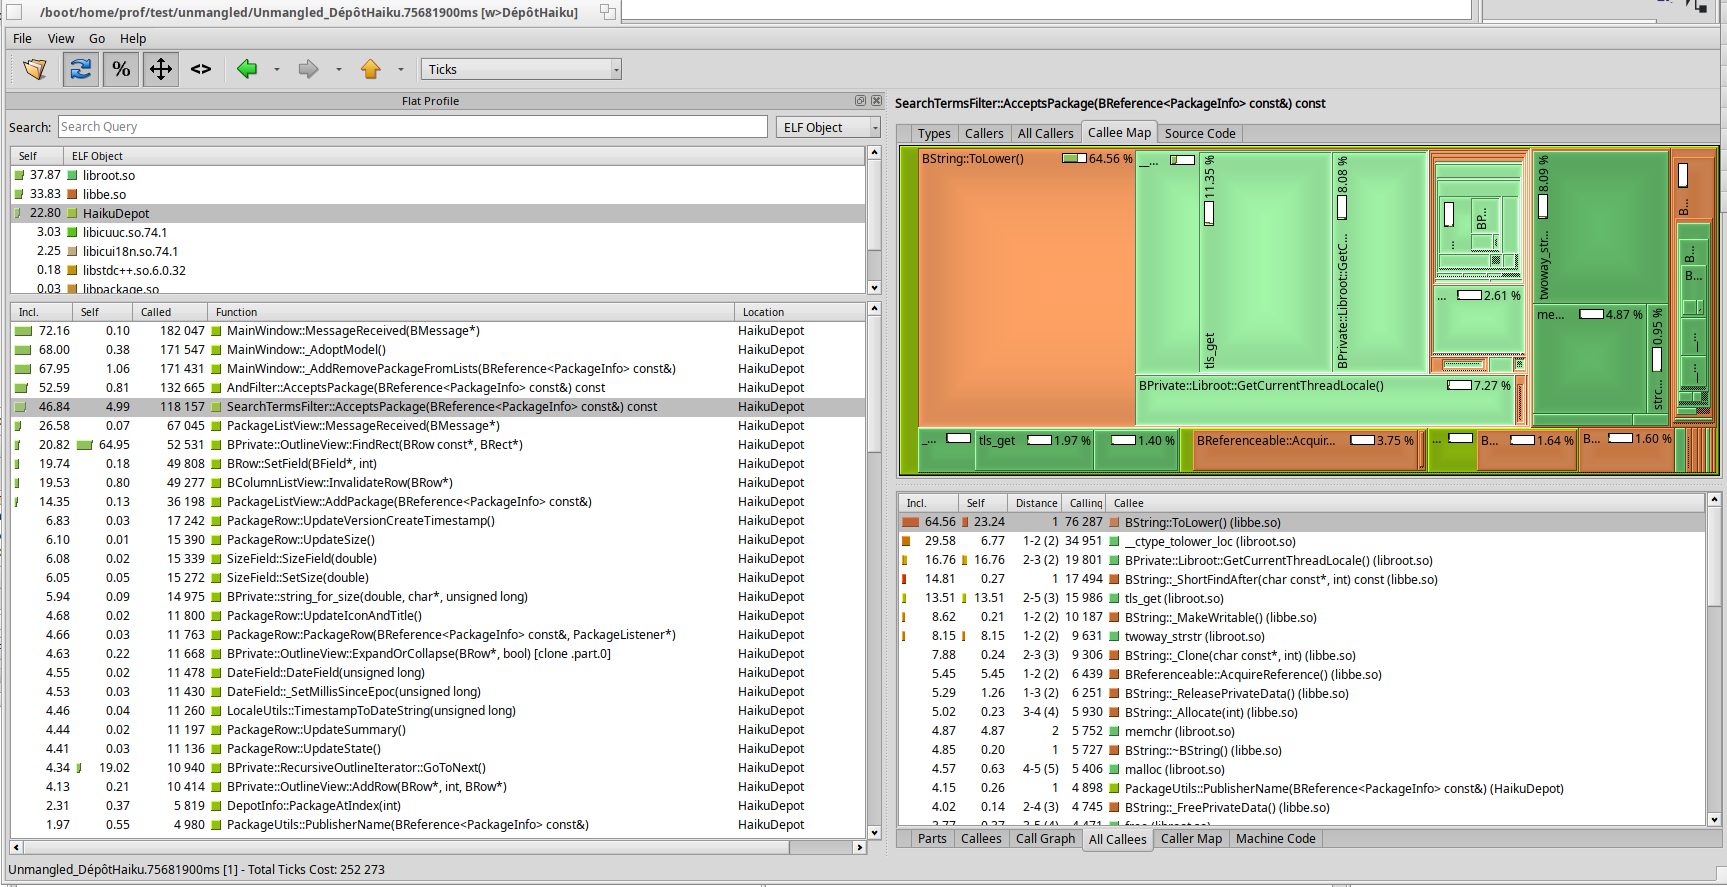
Here, the SearchTermsFilter::AcceptsPackage is hit in 46 % of the samples (first column on the left). If you look on the right view, the callee map shows all functions called from AcceptsPackage with a proportional area. Graphically, we see that ToLower is hit almost 65 % of the time.

The result of this analysis is that you should look at this part of the code to identify a way to optimize this path.

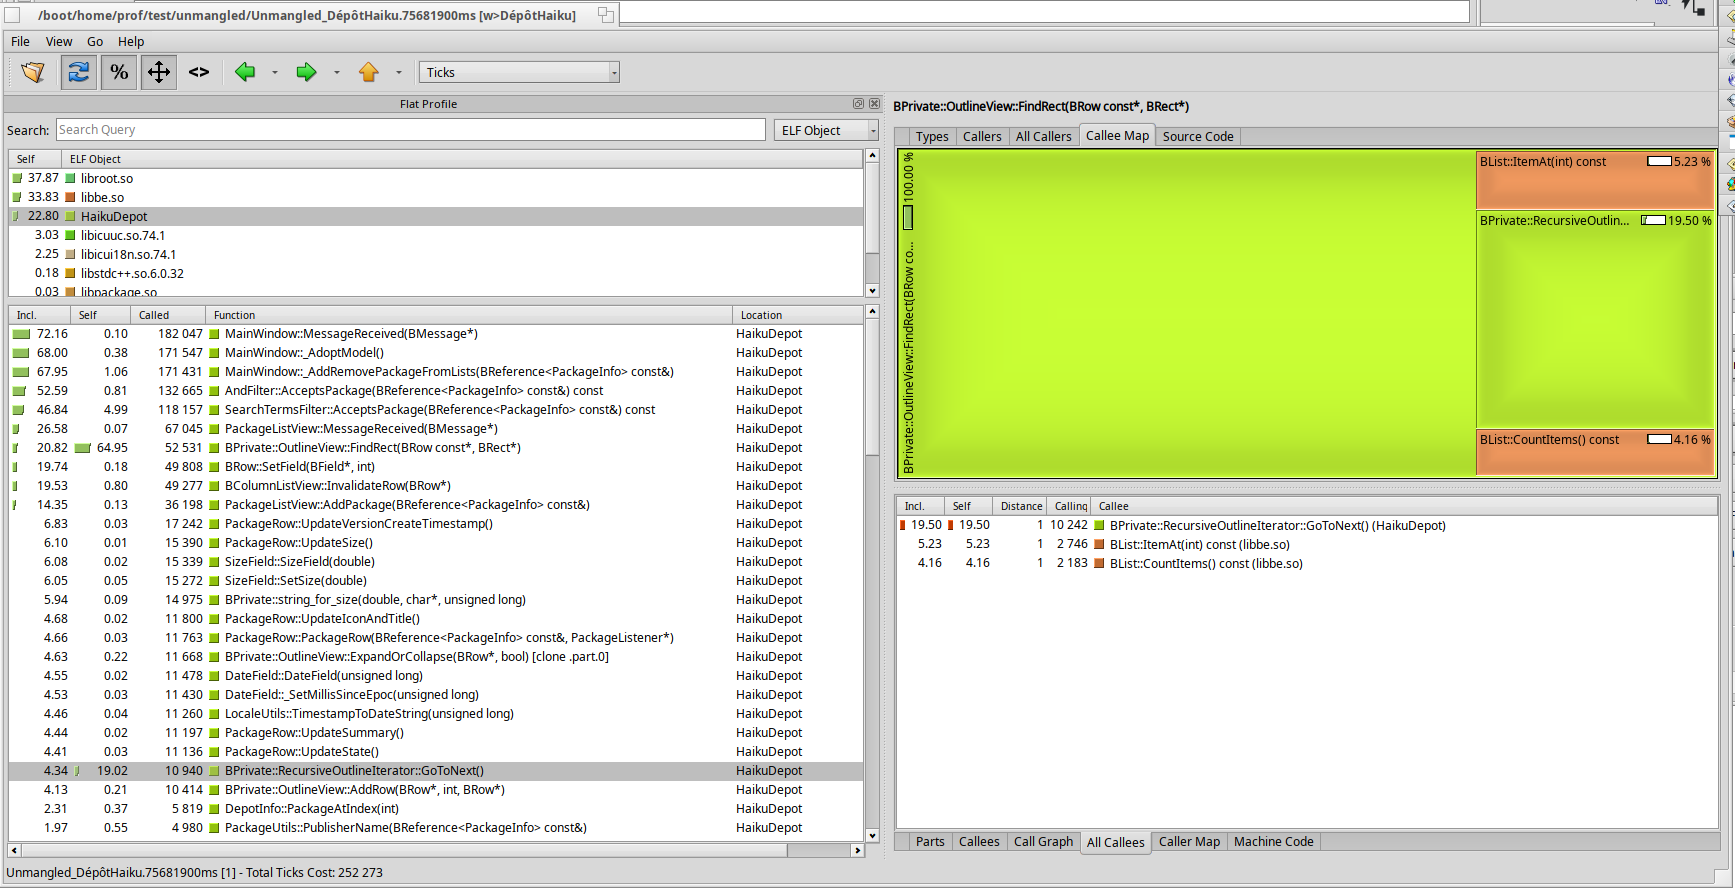
This view show another frequent case : the OutlineView::FindRect function has a large Self % : almost 65 % (large green rectangle). This pinpoint the fact that most of the time, we stop in the function itself, not in a subfunction. Maybe, there is something to investigate in the implementation of this function. Or maybe this function is called too often.

9 Likes

Hello @oco ; this is really interesting. It would be really good to add a blog entry in about this so that it is easier to come back to.

2 Likes

Is this really necessary? IIRC QCachegrind automatically demangles C++ symbols.

This is interesting because it’s not the results I was seeing when I first tested before applying your patch; ToLower was a much smaller percentage. But I am in an English locale which may bypass some of the locale-aware character conversion, though, which may make a difference.

Yes, it’s called extremely often on insertion of items.

Qt’s equivalent column list view class has a mode in which all items have a fixed height, rather than variable heights. This makes list redraws significantly faster, and would make FindRect() a constant-time function (at least in most cases).

But realistically, the ColumnListView class should really use a proper “model” system internally and not just add/remove items all the time. This would drastically improve its speed on large tables like the ones HaikuDepot uses.

Well, the process is pretty simple (you don’t even need to specify any arguments to profile beside -v really at this point, the defaults are pretty good.) The QCachegrind documentation should explain most of this already, I think?

It’s pretty simple when you have already done it, but not everyone is familiar with the tools. How would people even know that QCacheGrind exists?

I will have a look at integrating this into docs/develop. Yes, it’s not very long because that process isn’t so complicated, but having it clearly documented all in one place is really helpful.

8 Likes

Oh, this is the Qt-only variant of KCachegrind:

KDE has two other profiler frontends:

Any of these are best paired with CodeVis (codebase visualiser) for large C++ codebases:

Heaptrack can’t be build on Haiku, missing some library for that IIRC, last time I checked Codevis it didn’t have an official release tagged?

… me checks again there :slight_smile:

Yep, still no official release on Codevis that I can see at invent, but it works :slight_smile:

1 Like

Maybe, but at least it is not the default under Haiku yet and i didn’t find an option in the UI (didn’t look at the documentation though). My initial goal was to quickly investigate a performance issue in HaikuDepot i had discovered with my old eee pc like computer at FOSDEM. I have investigated unmangling later when writing the tutorial to have more user friendly screenshots. And stopped, once i have found a good enough solution for me.

Or maybe it is because i used a release build, without debug informations ? It was enough in my case to have a glimpse of the issue.

French version here. I also have every packages in my HaikuDepot :

  • development packages
  • sources package

Maybe that could explain the difference, with even more ToLower calls.

1 Like