App_server font cache is causing high CPU load in "low resource manager" thread and cause mysterious resource exhaustment

When experimenting with test_app_server sometimes I get some strange situation:

  1. test_app_server display following in stdout:
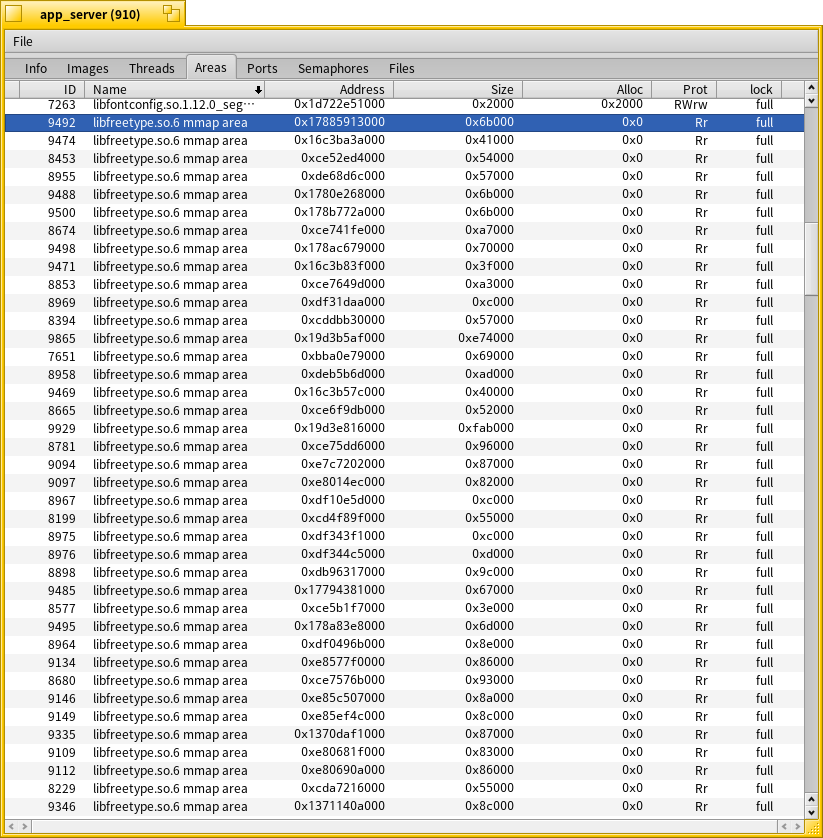
FontCacheEntry::Init() - some error loading font file /boot/system/data/fonts/otfonts/NotoSansCJKjp-Regular.otf
FontCache::FontCacheEntryFor() - out of memory or no font file
  1. “low resource manager” kernel thread start to significantly consume CPU. I am not understand what this thread is doing and I had issues with it in past.
  2. test_app_server will freeze for several seconds.
  3. Debugging API will stop working. Attempt to attach debugger by my SystemManager, Haiku Debugger will cause unknown crash, attempting to save report will also crash.
  4. Screenshots stop working.
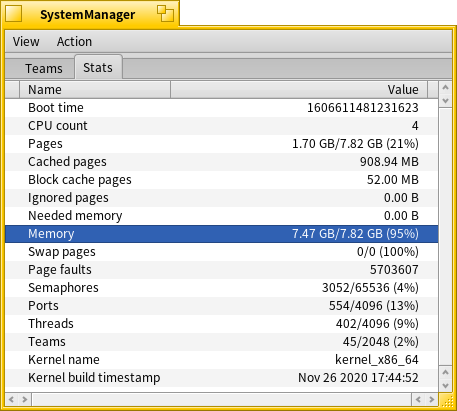
  5. No known system resources (memory, teams, threads, ports, semaphores) are exhausted. SystemManager show no more 13% of any resource usage in Stats tab.
  6. When terminating test_app_server system is recovered.
  7. Following is written to syslog:
KERN: low resource memory: warning -> critical
KERN: 0xffffffff9e00aa40->VMAnonymousCache::_Commit(16429056): Failed to reserve 16429056 bytes of RAM
KERN: 0xffffffff9dc76968->VMAnonymousCache::_Commit(394526720): Failed to reserve 19267584 bytes of RAM

Message similar to last line is repeated. System is 64 bit.

Issue can be reproduced by resizing TextRendering or FontSpacing window in test_app_server.

Anybody has ideas what is going on and what resource get exhausted?

From the messages, I would guess that memory allocated for font cache is exhausted. Maybe is it possible to allocate more?

Why it is not displayed in memory check utilities (ProcessController, listarea etc.)?

Indeed, it would be useful but it’s probably not supposed to happen in first time.
It’s possible that nobody thought that one day it would be a problem.
Maybe some of the tools were also written when it wasn’t existing.
I guess that it is a fixed value that has been fixed when there wasn’t a massive font use. Now browsers and office apps can cache a lot of font families.
I’m not a coder at all so I try my best to guess…

Probably all physical memory pages have been reserved (though probably not all are actually in use) and the system did not figure out a way to free enough to allocate anything.

I found that sAvailableMemory kernel global variable is used to track memory available for allocation, allocation failure is caused here. sAvailableMemory variable is available from userland by get_system_info function and system_info.free_memory field. sAvailableMemory initial value is set here and it has the same value as system_info.max_pages * B_PAGE_SIZE (it is set here).

system_info.used_pages value seems to be inaccurate, there are TODOs (1, 2) about it. Calculation based on system_info.used_pages and on system_info.free_memory may produce significantly different results. Most memory inspection tools (ProcessController, listarea, ActivityMonitor, Slayer) are based on system_info.used_pages and produce wrong results.

I fixed free memory calculation in my SystemManager and now it display correct values:
SystemManager memory

4 Likes

Nice catch! AboutSystem too?

Yes. The only Haiku built-in application that can display real used memory is vmstat (it is the only program in Haiku source tree that use system_info.free_memory field), but it display free memory instead of used memory, used memory need to be calculated manually.

Currently only SystemManager can directly display correct used memory.

1 Like

@mmlr probably know more details.

app_server high memory usage is likely caused by libfreetype.so.6 areas. It create a lot of areas with zero allocated size and read-only permissions. It is probably file mapping of font files. It should not consume RAM because data can be read from file at any time and copy on write can’t be used (area is read-only).

freetype areas

1 Like

Some words on memory usage and low_resource_manager.

The idea is that there are two types of “used” memory. One part is used for somewhat permanent storage (say, an application heap and stack areas). Another part is used for caches (disk cache, file cache, etc). This second part is a bit different because it can be freed at any time if needed: you just need to flush the content of the area to disk (if it was modified) and you can reuse the memory pages for something else. This is what the low_resource_manager does: it keeps track of the memory usage, and decides to trim down these caches when needed.

So, what AboutSystem and other tools report is the memory usage ignoring these caches. Otherwise, people will complain that Haiku is a resource hog and uses all available memory (well, of course it does, it would be sad to leave it unused when we can make profit of it to have things run faster). So, we only report the non-easily-releasable part there to make people happy about how light and small Haiku is. It seems less confusing to them users.

The summary is: there is no single right answer to “how much memory is the system using?”

In ProcessController memory menu you can see this “easily releasable” memory shown in light blue I think.

(this does not exclude bugs in the memory accounting, which can also be improved. In the early days before alpha1 we had Haiku reporting negative memory usage in some cases…)

Well, mmap still requires the data to be cached in RAM at some point so that the code can access it as if it was memory. So, these areas can be removed at any time if needed, without flushing back to disk. It should be a pretty fast process. But it seems the low_resource_manager has trouble doing this and ends up using a lot of CPU. Maybe there is some inefficient algorithm there trying to scan all areas to see what can be released, or maybe it’s desperately looping over all areas, seeing that none can be flushed anywhere, but still the memory usage is too high?

Did you confirm that the font cache is the problem, or is it only a victim of something else in test_app_server actually using up all the available memory? I would search for a few very large areas, or a large number of areas with non-0 “alloc”, unless these areas with 0 reported alloc actually use up some pages?

1 Like

Used memory information based on used_pages is definitely wrong. Used memory counted by used_pages and by free_memory can produce dramatically different results and memory is not released no matter how long waiting for it. Memory allocation requests will always fail until explicitly release memory.

It is better than reporting that there are a lot of free memory and consistently failing memory allocation requests.

That seems the case. Situation do not became better then waiting for some time. Just stable high CPU usage by “low resource manager”.

Yes. FT_New_Face is mapping font file to memory. It was caused by memory leak that I introduced here. After fixing memory leak, memory usage counted by free_memory is not growing anymore.

Could it be that space allocated for fonts aren’t freed because they report 0?

We should definitely display used_pages vs. free_memory, indeed, not only used_pages (as even without whatever the bug is here, it is possible to have all memory legitimately reserved but only a few pages used.)

This appears to be a different problem, though: memory-mapped files actually reserve memory. I commented on the ticket.

No, that has nothing to do with it. Operating system memory management is an extremely complicated subject; if you do not fully understand all the moving parts, it is very easy to get lost in the weeds.

1 Like

Same problem is present in Git (often triggered in WebKit repository). It maps large files as read-only memory blocks and fails because each mmap reserve memory (decrease system_info.free_memory value). Reserving can be not used for read-only mappings.

I considered on how Haiku maps/unmaps files and/or devices into memory affects app_server.

Maybe worth a gander or two. Specific mmap calls seem to still ‘hang’ which may affect Haiku’s memory and thread management under certain conditions.

Sorry, but I don’t understand what you are saying here.

Specific mmap calls seem to still ‘hang’…

Referring to Open POSIX tests:
conformance/interfaces/mmap/24-1: execution: HUNG
conformance/interfaces/mmap/6-1: execution: HUNG
conformance/interfaces/mmap/6-2: execution: HUNG
conformance/interfaces/mmap/6-3: execution: HUNG

So, are apps like app_server (or moreso like Web+) affected or not… ?

That usually does not mean the syscall hung. See what strace says.