Fixed after the latest force-push in the gdb-15-haiku branch. The haiku_in_dynsym_resolve_code callback was updated.
While runtime_loader itself does not contain any symbol resolver stubs, GCC still emits stubs in the .rela.plt section. Not reporting these compiler-generated stubs makes GDB think they are real functions. This confusion prevents the step command from working properly.
From what I understand that is another independent implementation of the protocol that gdbserver uses. The GDB frontend then connects to the KDL and debugs the Haiku kernel.
Theoretically gdbserver has an in-process mode that might be adapted to be compiled into the KDL itself, but that would be technically challenging, not to mention GPL infection.
It can be one night of work (if you just need the mandatory support for reading registers) or much more (if you want better support like signal stepping and other things I’m currently handling right now).
Mail me a RISC-V device and I’ll implement that after GSoC.
The KDL GDB stub is only really useful for debugging things outside of VMs. When debugging in VMs, you can just attach GDB to the VM’s GDB stub instead, which is exponentially more useful (since you can step through the whole system that way, not just inspect things in KDL.)
The whole idea behind the file is inherited from the old port and is seriously flawed. solib-* should not query the local operating system (e.g. making syscalls like get_next_image_info), but gather information based on the abstracted target and address space.
With the old implementation, when a Haiku GDB debugs a process managed by a Haiku gdbserver on a remote computer, solib-haiku.c functions would still think that the inferior is a local process and call get_next_[*]_info on the wrong computer.
Currently, I’m trying to phase out that implementation in favor of the existing solib-target.c. I’ve already migrated the code for relocating the main executable offsets to haiku-nat.c (which is allowed to access native local interfaces). The next thing to do is implement the TARGET_OBJECT_LIBRARIESxfer operation in haiku-nat.c: We would need to translate output by get_next_image_info into a bunch of XML.
Than one I used, but VM’s GDB lacks OS-specific information that KDL GDB stub could easily provide (e.g. threads, teams, drivers info). I assume it’s possible to overcome it in VM’s GDB with a bunch of Haiku-specific GDB macros. If you happen to use those or have other tips on debugging Haiku in VM, I’d love to read a post about them.
I haven’t been using GDB with Haiku VMs for very long, but I probably will come up with macros like that at some point. For the moment I just use add-symbol-file with an offset specified for whatever images I am trying to debug besides the kernel itself.
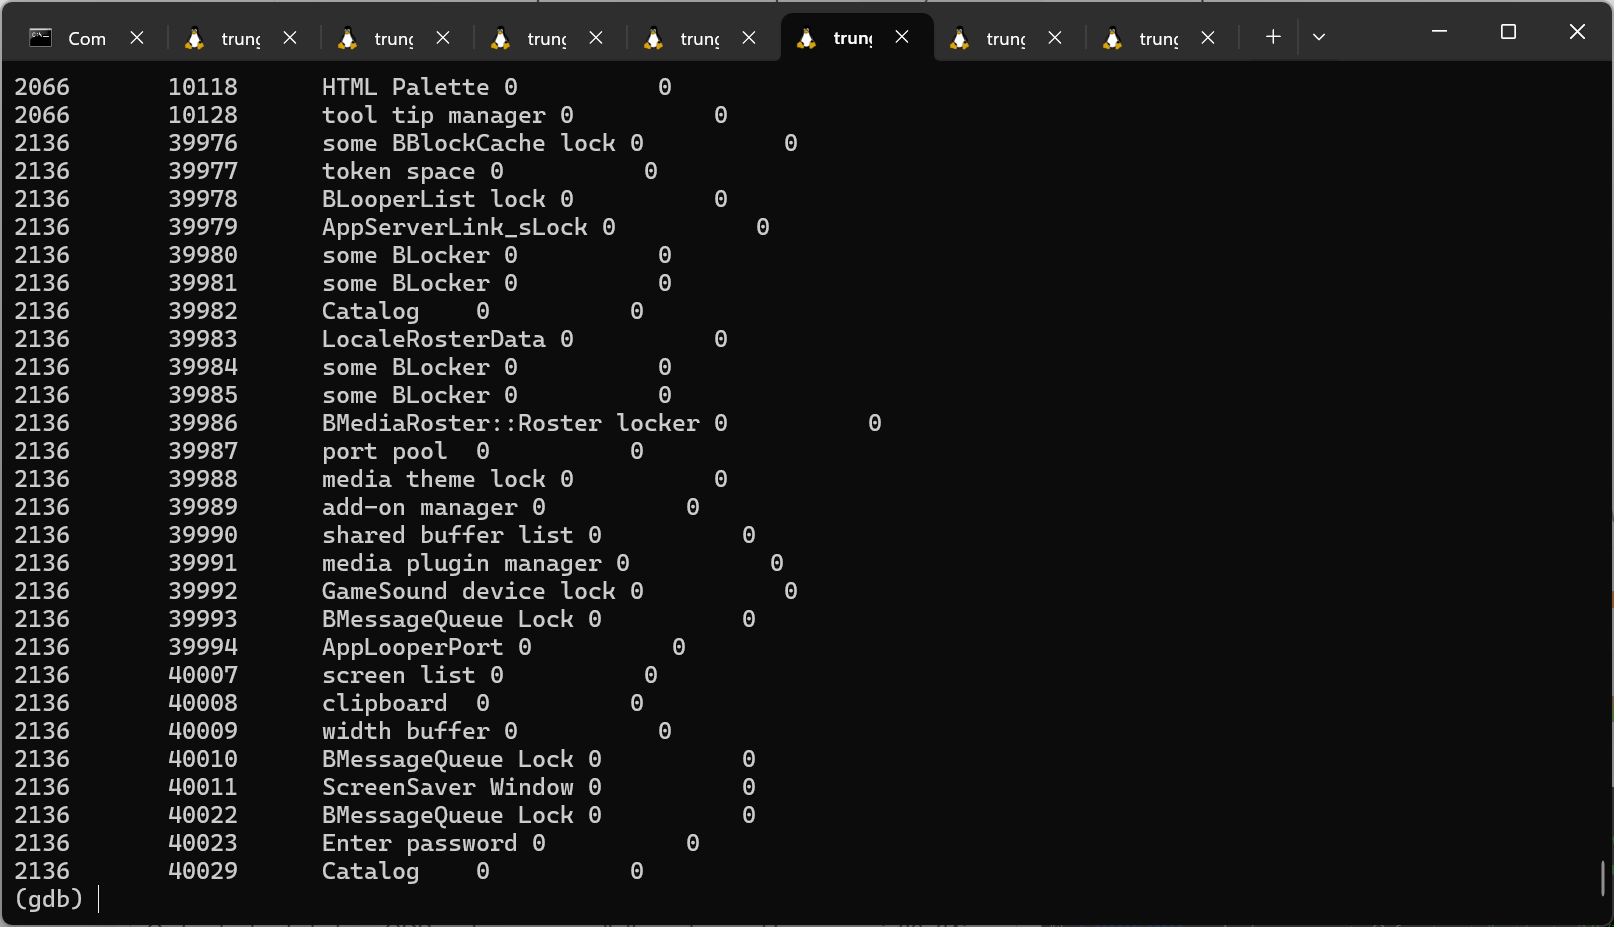
Since I had to implement xfer_osdata on the way, I also implemented the fetching of some potentially useful Haiku-specific data like ports and semaphores.
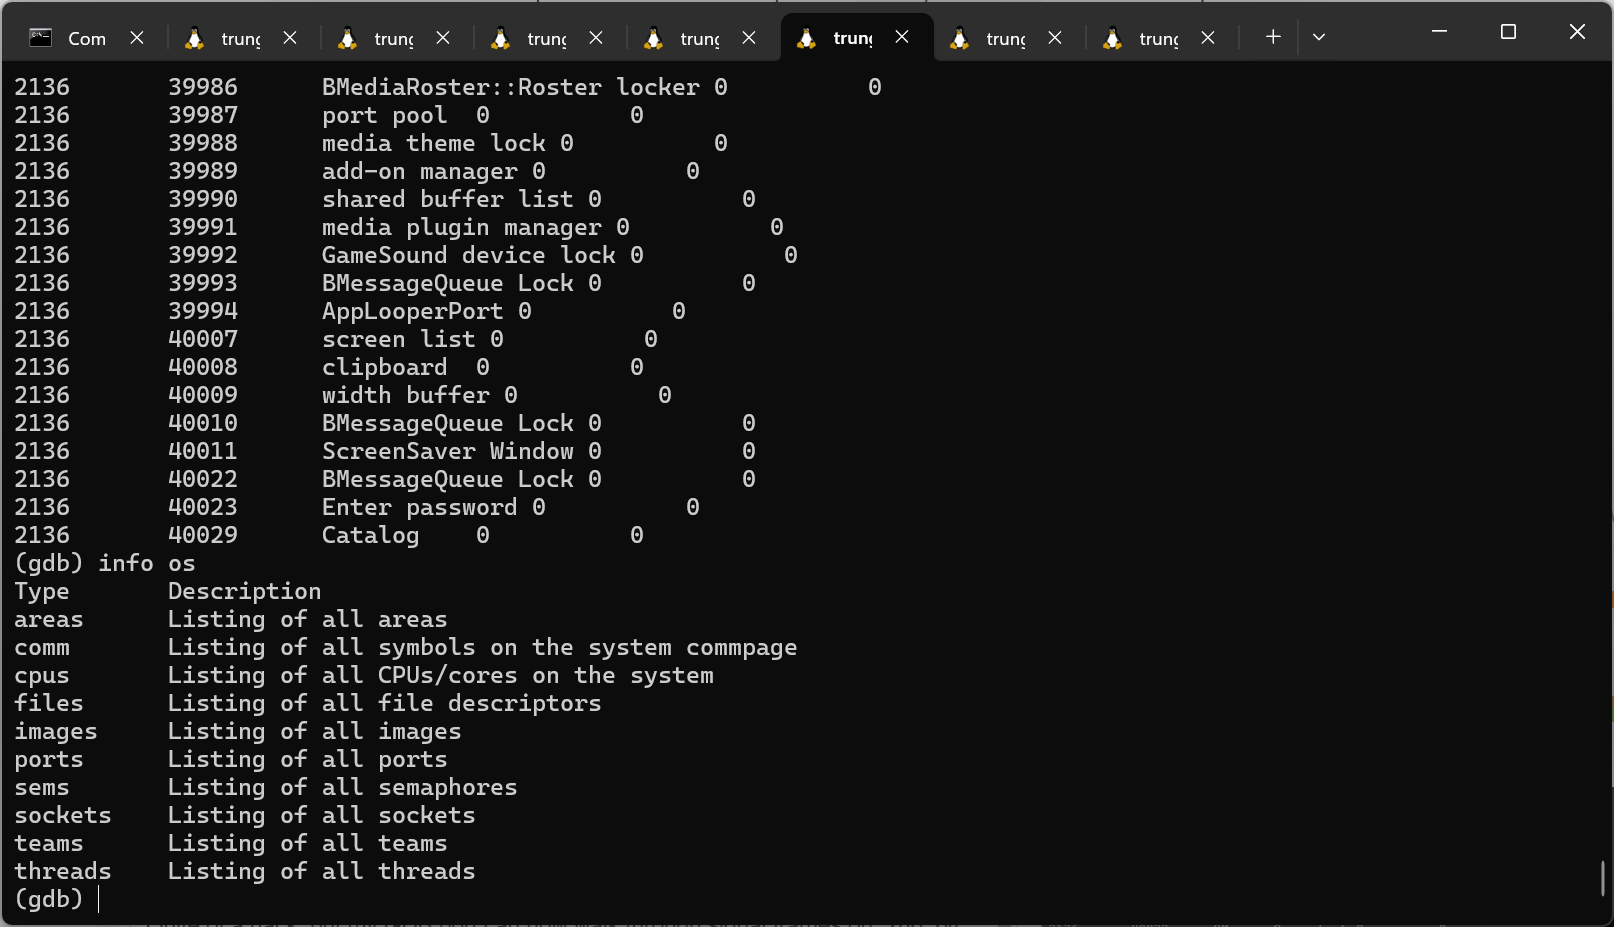
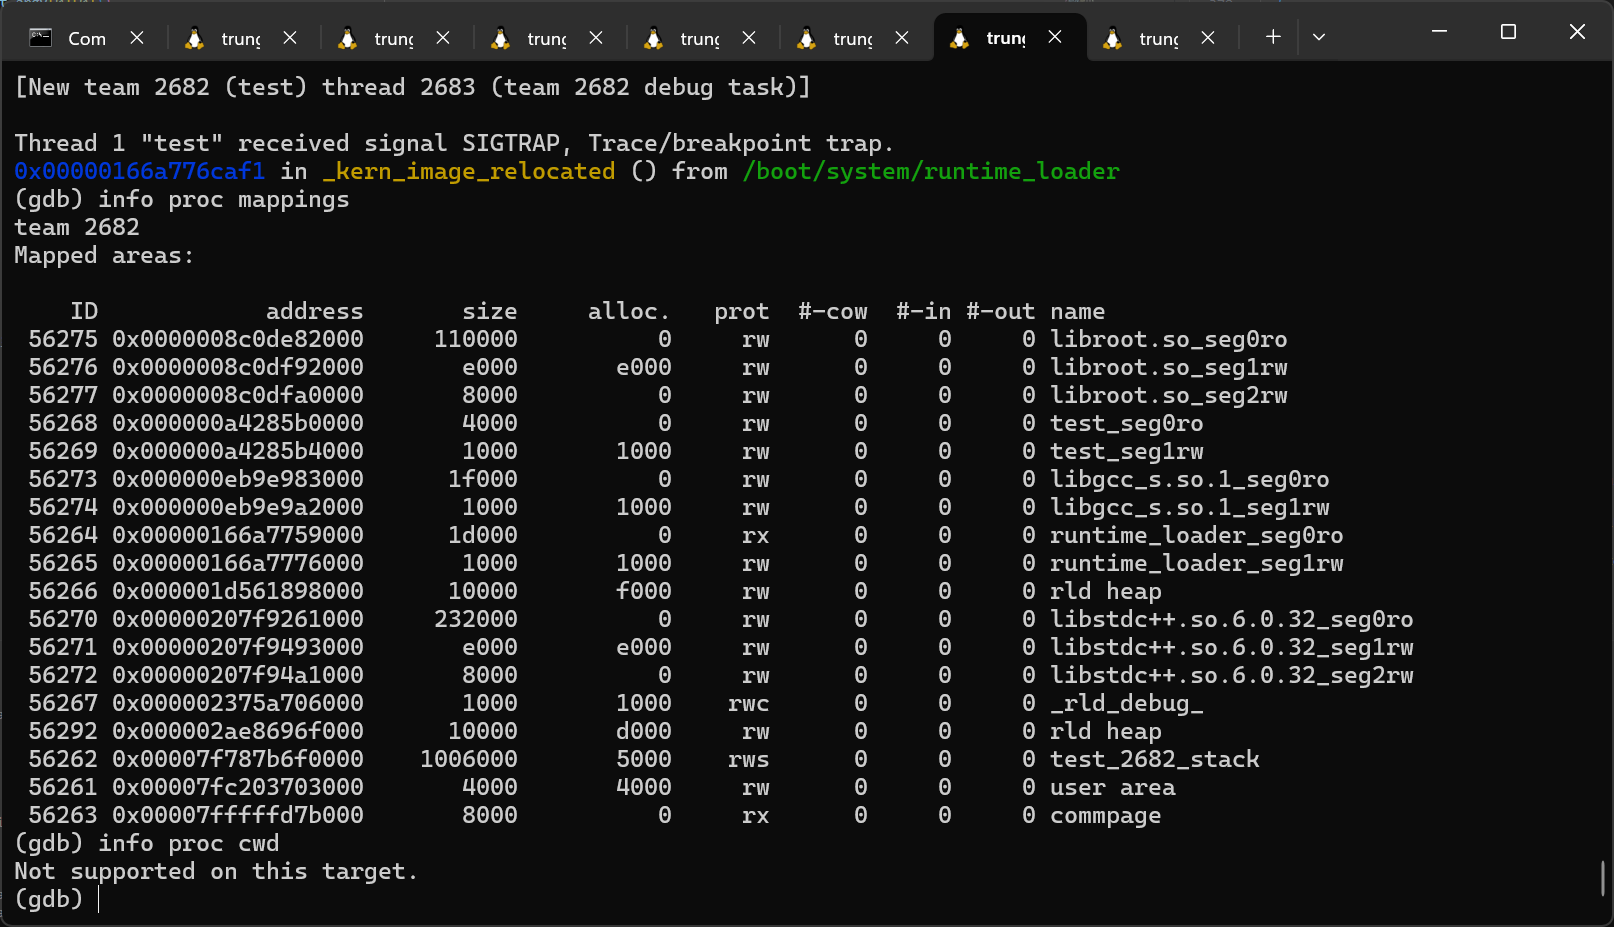
Some more quality-of-life features. info proc (the thing many StackOverflow questions on GDB points to) should work on Haiku, except for info proc cwd since there isn’t an easy way to get the CWD for a different team.
Can you do an info dll, or otherwise get a list of loaded libraries recognized by gdb?
The last update contains some changes on how shared libraries are handled, which may (but should not) interfere with symbol resolution. GDB would then get wrong addresses and fail to write breakpoints.
Interaction with GDB is handled automatically by Netbeans, I do not know how to inject custom GDB commands during debug session.
Can you try to reproduce problem in Netbeans yourself? Netbeans support remote build and debug via SSH, so you do not need to install Netbeans in Haiku. It use regular GDB, not gdb-server.
Thanks for the log. I’ve been able to reproduce the issue locally with that.
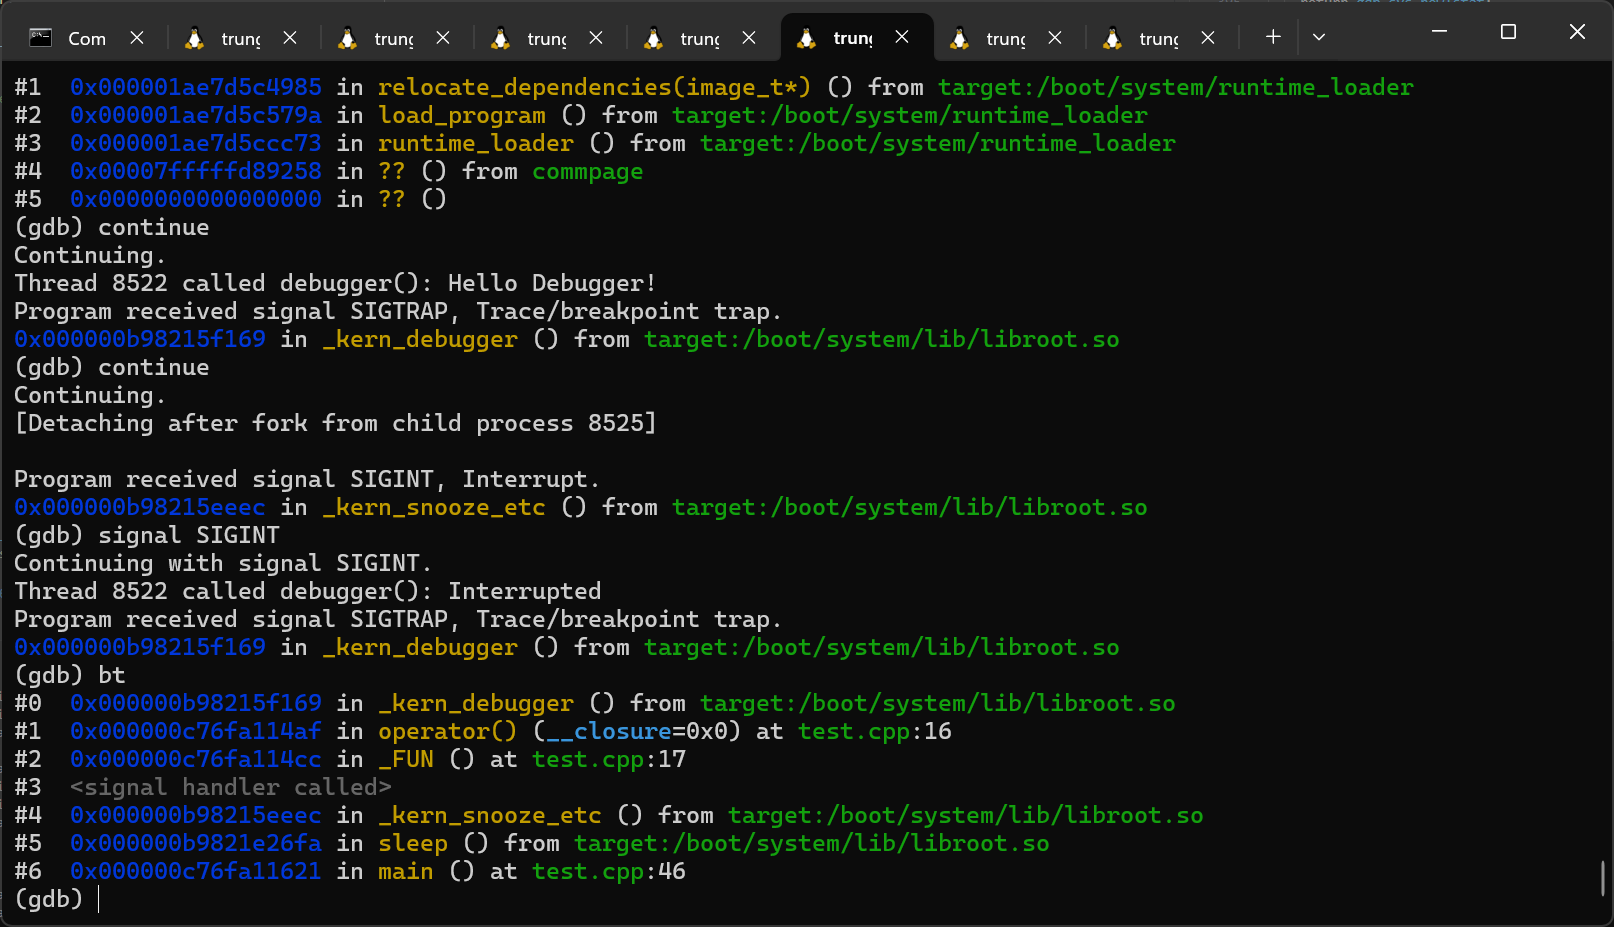
The issue seems to be that Netbeans tried to set an initial breakpoint at _start to stop the program. But the breakpoint was set too early.
For some reasons, by default, GDB does not directly launches its inferiors, but starts a shell, usually bash. This _start symbol resolved to the address located in the bash binary.
After bashexecs into the real inferior, GDB somehow fails to refresh the breakpoint list, and tries to write into an unmapped memory region, causing the error.
For this project I’m OK with using a few internal syscalls here and there by importing the corresponding _kern functions as weak symbols and putting guards around them.
However, pulling the entire private KMessage isn’t a very future-proof solution.
Best I can do right now is to add a TODO for this.
What is the problem with KMessage? GDB already contain C++ code and referencing C++ classes should be not a problem. You can wrap access in a separate compile unit if needed.
Debugger already use various internal OS details, so I think KMessage is acceptable here.