So I’m really wondering in which use cases today Debugger is working fine.
So far I’ve got only 1 application recognized by Debugger : a one 1 file application (simple OpenGL app)
Anybody has some success on this ?
I’m currently working on a article on how to generate debug infos for haiku official apps and the way to debug them.
EDIT : I will advice both Debugger and GDB
Again, for specific issues please open tickets.
Dwarf5 is implementef iirc, so a lack of implementation is not the problem. Potentially problems with it still exist (but then you can tell gcc to use a previous dwarf format too.)
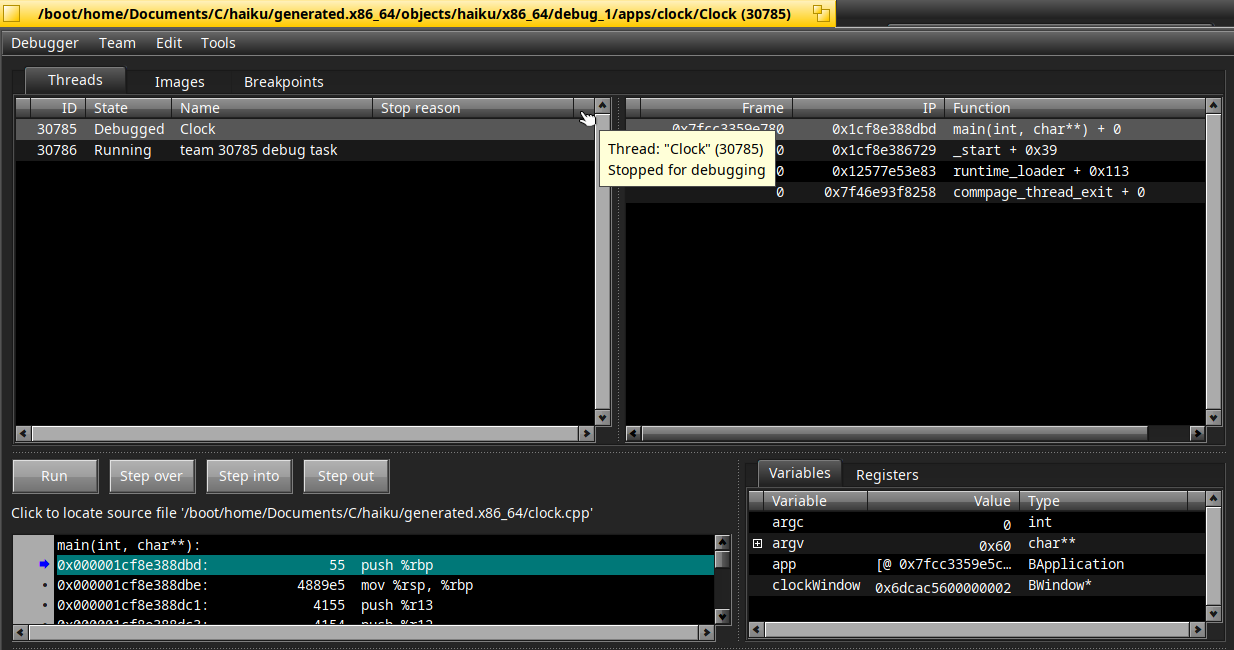
Have you actually tried the “Click to locate source file” option?
Presumeably gdb in qt creator, in the context of a project, has to know where the source file is… But i don’t see how you expect Debugger to figure this out without info
Ok I find something : if I put the source files in the directory “generated.x86_64” ii’s working fine !
So maybe it’s something relative to how Debugger is determining the sources directory to look for, or another option is that during the build the directory indicated is not accurate ? (I don’t know if debug info are putting directory location for files)
Ok got it thanks ! So I confirm it’s working fine now.
The “issue” seems to be relative to the build :
“jam -q Clock” is considering the sources files are in “generated.x86_64” instead of “src/apps/clock” hence the confusion + I didn’t see that nice feature to select the sources path.
A thing to note here, when apps crash the “generate report” option is quite helpfull for debugging the OS, it gives a text readable backtrace etc for upload, compared to a core dumb the debug symbols are only needed on the generting system, not for the insoecting person (and the report is readable online directly)
I have experienced similar issues. Somehow I got it working once, but not anymore.
I’m on latest nightly as of today and use Genio.
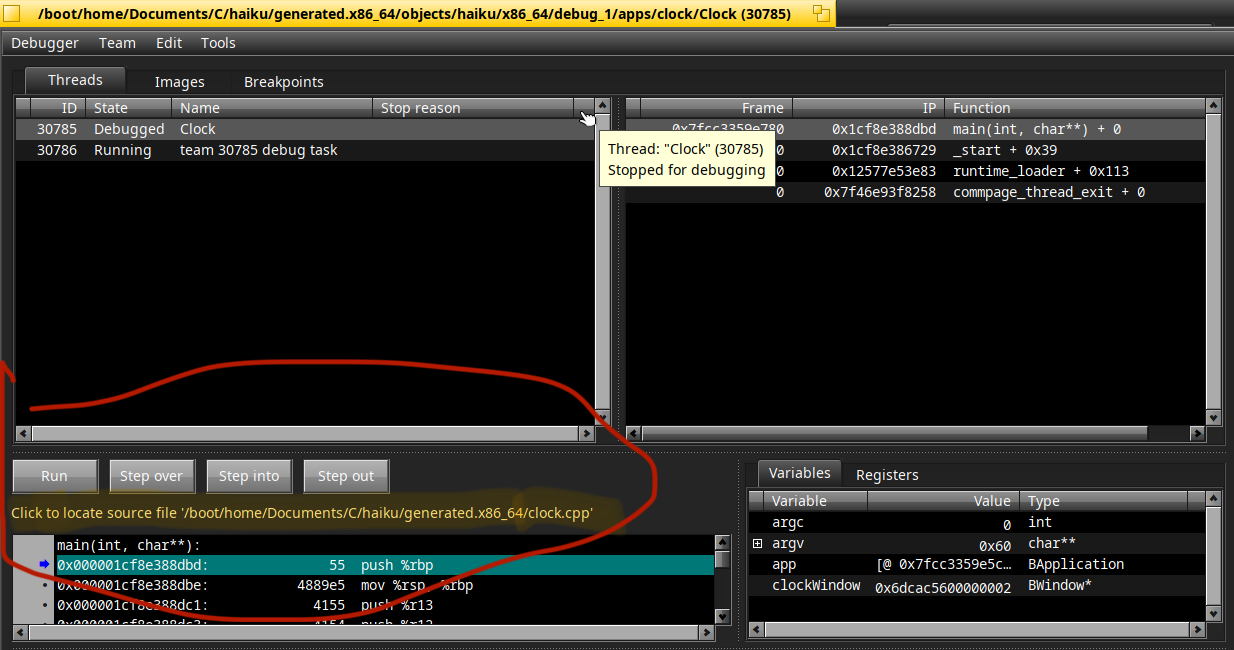
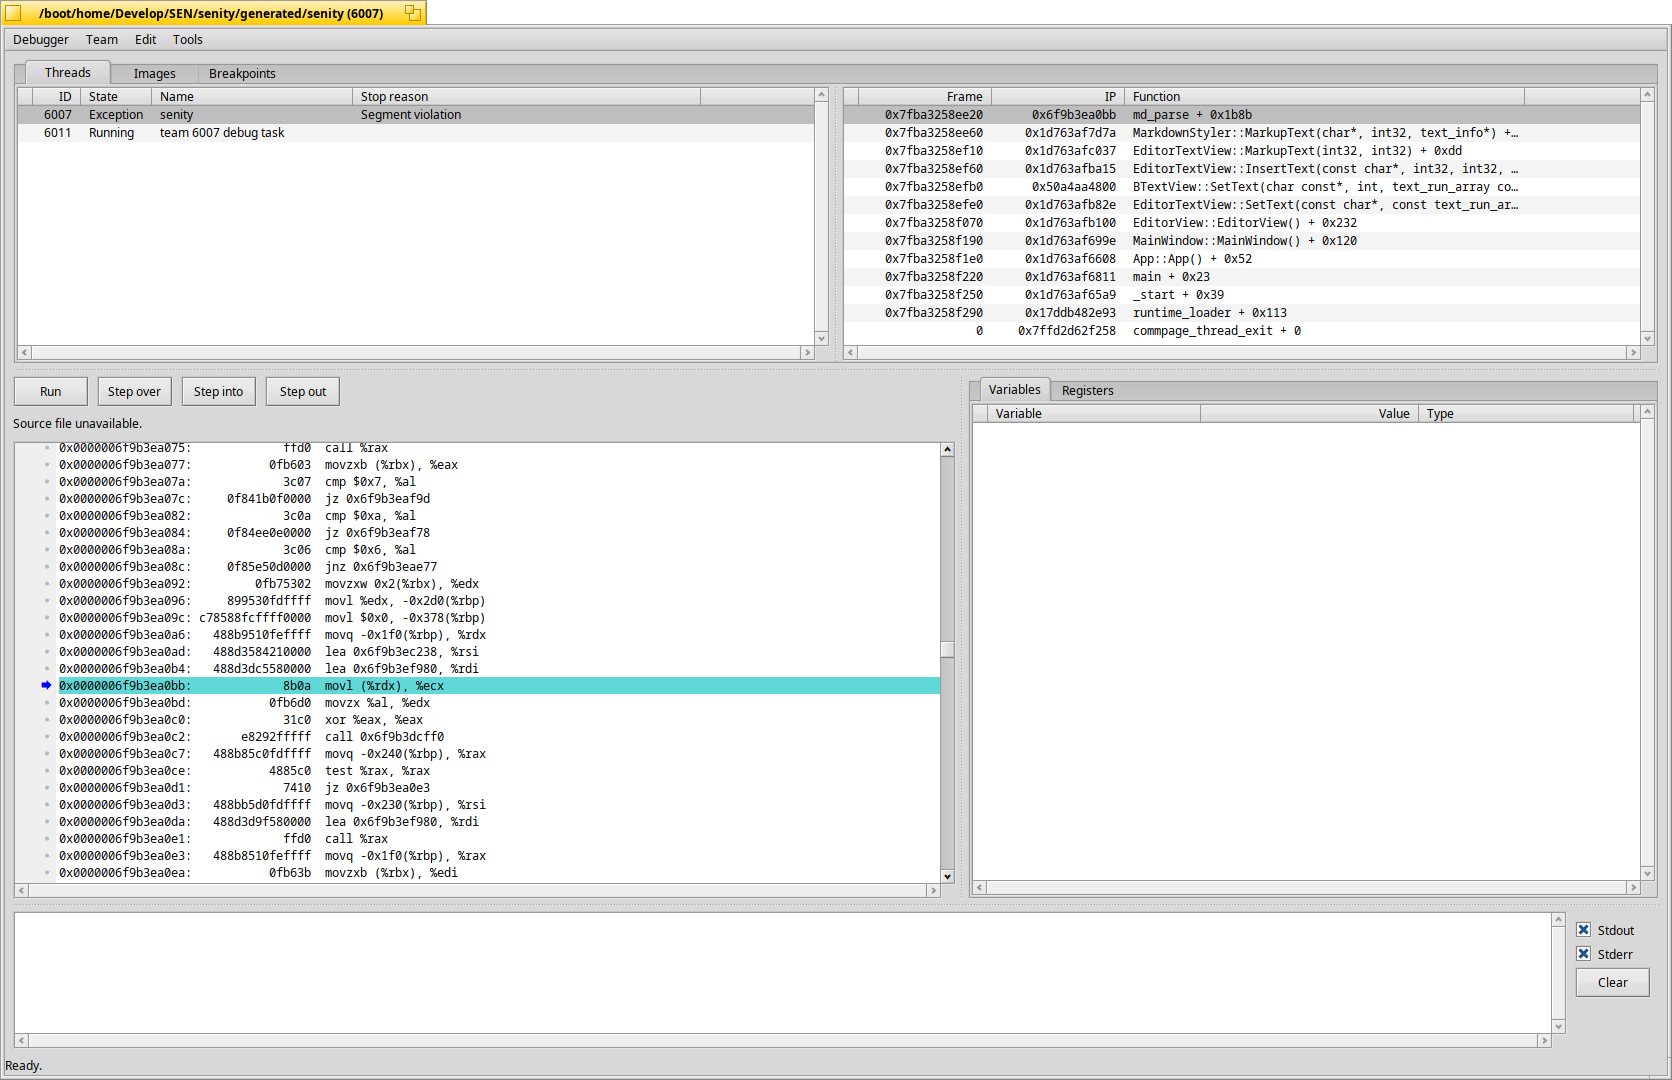
Debugger cannot find the source, and I cannot find the select button (see screenshot).
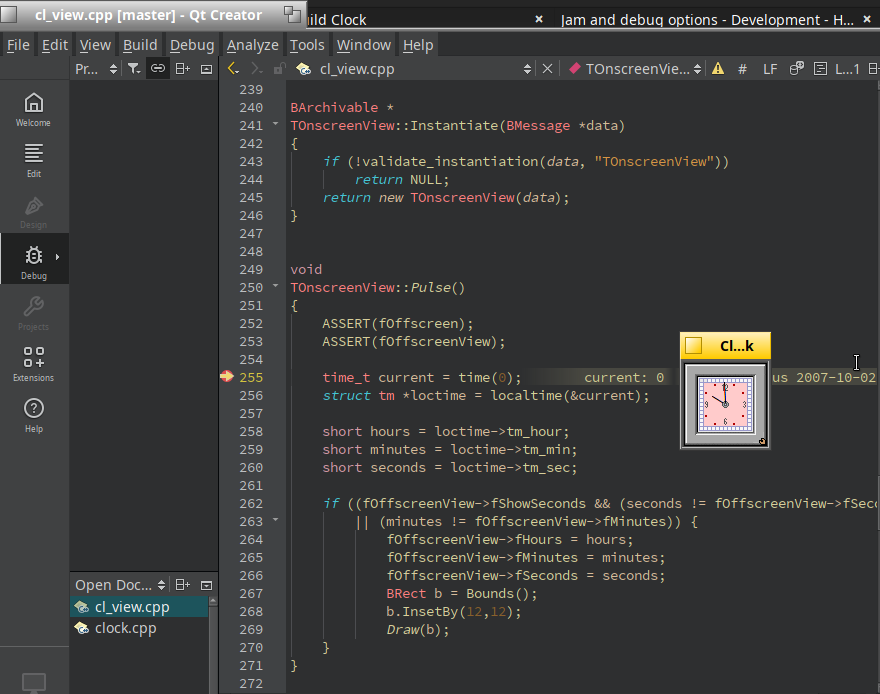
GDB works fine and sees the source, but is a PITA to use.
Also tried a manual make (as opposed to Genio build) with explicit DEBUG setting in Makefile:
#   Specify all the preprocessor symbols to be defined. The symbols will not
#       have their values set automatically; you must supply the value (if any) to
#       use. For example, setting DEFINES to "DEBUG=1" will cause the compiler
#       option "-DDEBUG=1" to be used. Setting DEFINES to "DEBUG" would pass
#       "-DDEBUG" on the compiler's command line.
DEFINES = DEBUG=1

#       With image symbols, stack crawls in the debugger are meaningful.
#       If set to "TRUE", symbols will be created.
SYMBOLS := TRUE

#       Includes debug information, which allows the binary to be debugged easily.
#       If set to "TRUE", debug info will be created.
DEBUGGER := TRUE